Overview of the DISH POS BI Analytics board
You access booq BI easily and quickly through the well-known booq Back office via booqcloud.com.
In this article, we give you a tour of the functions of the DISH BI analytics board, which enables you to run your business more data driven.
DISH POS
BI Basic: By default, DISH POS BI gives you access to a number of insights that are visually displayed by basic reports. You will be able to classify your turnover by time, location, payment method and employees.
Step-by-step instructions
- Go to the menu item Finance
- And select DISH POS BI
- A window will open in a new tab and the DISH POS BI dashboard will be displayed
Dashboards
To switch between different dashboards, use the menu icon in the top left corner. A list of available dashboards will then be displayed, from which you can select the corresponding dashboard.
BI BASIC SALE
For now, we are going to show you the functions of the dashboard. Each dashboard has the same logical structure.
Dashboard options
In the top right corner, we find several options to apply to the dashboard. Let's explore them all.

Reset
When working with the dashboard and changing configurations, you can always reset the view to the default by using the corresponding icon (circular arrow with clock inside).
Filter
By default, the dashboard is set to the current month, in other words it looks back exactly 4 weeks from today. To quickly display data from a specific date range, like a quarter or a holiday period, use the filter icon.
- By using the search bar, you can filter for pre-defined periods
- Or filter for a specific date by using the from-to function
Refresh
To refresh all the data on the dashboard, click on the corresponding icon (two circling arrows).
Further options
For more options, click on the three dots.
- You then can send yourself the data of the dashboard via mail, simply click on Send this dashboard
- By clicking on About, various technical information about the DISH POS BI tool will be displayed
Tiles
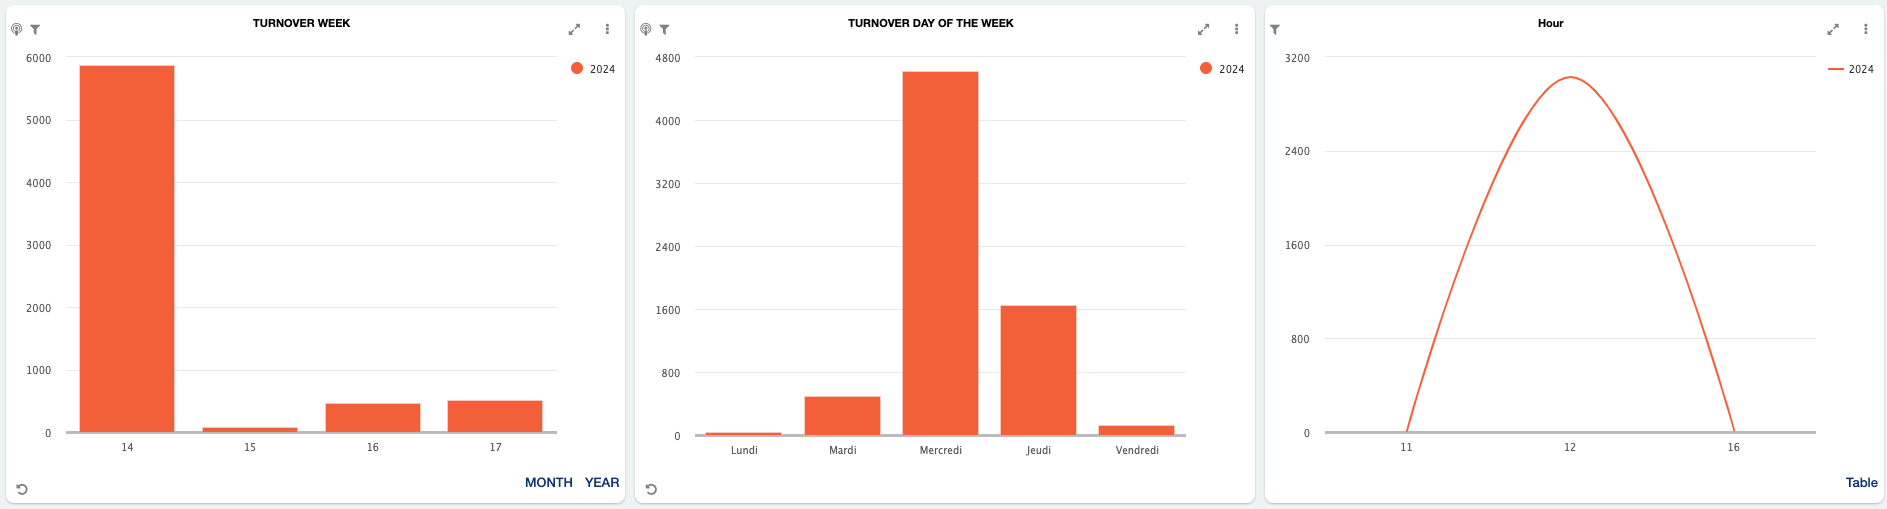
The top row of tiles displays the turnover in relation to time, e.g. sales per week, per day, sales per hour
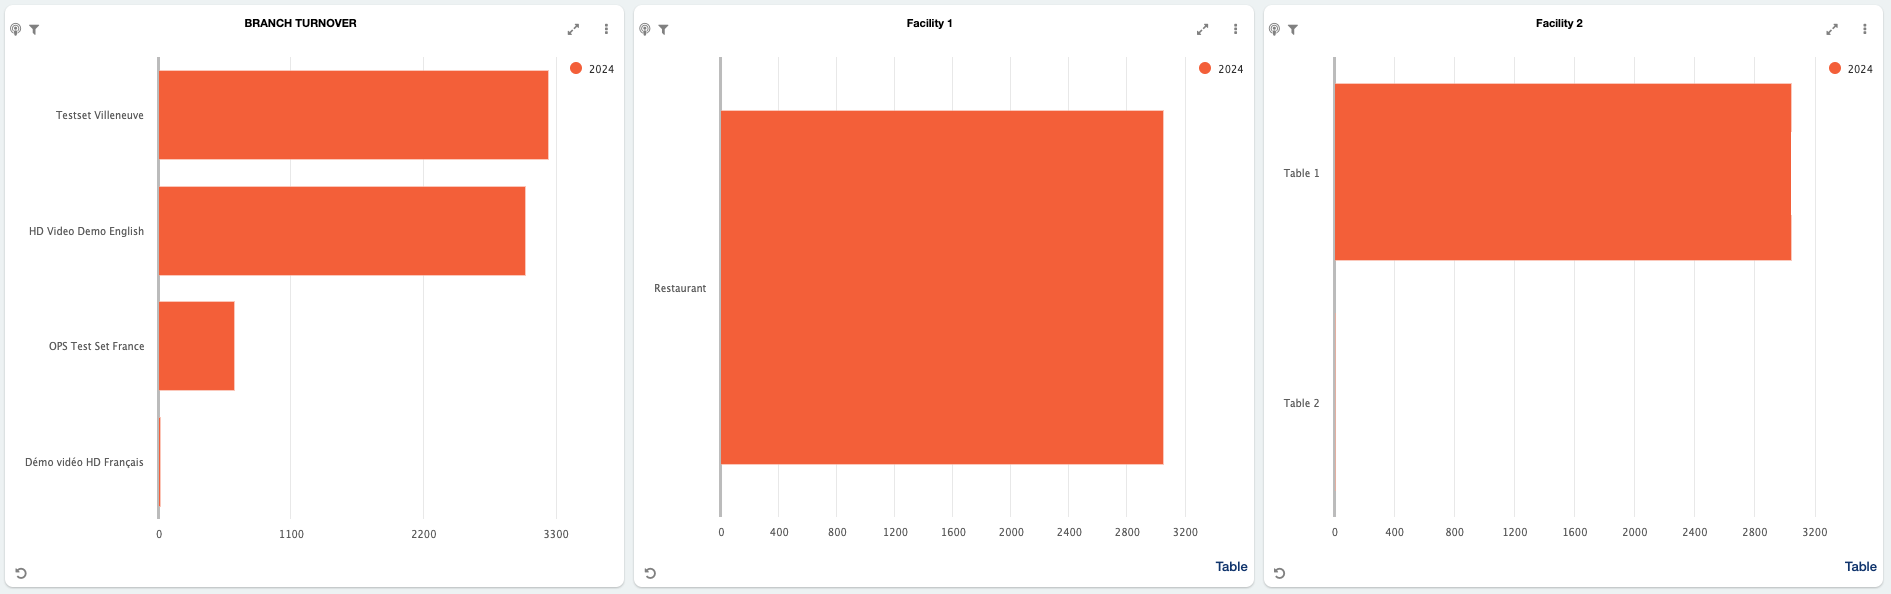
In the second row of tiles, we find information regarding the turnover in relation to its location. Here all the branches and sales points are shown.
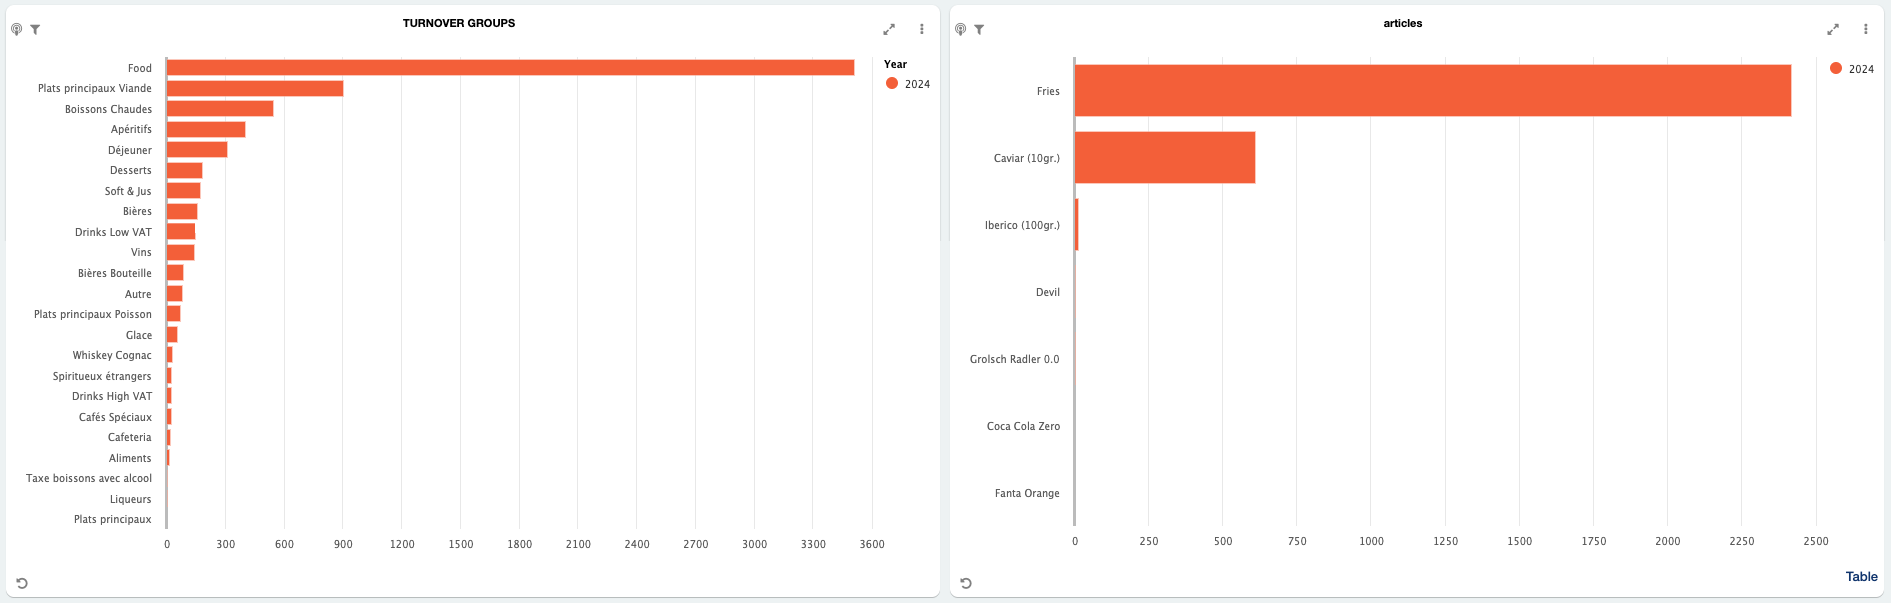
The third row of tiles is about the product groups. For example, insight into the turnover and the number of products sold per turnover group, product group and specific products.
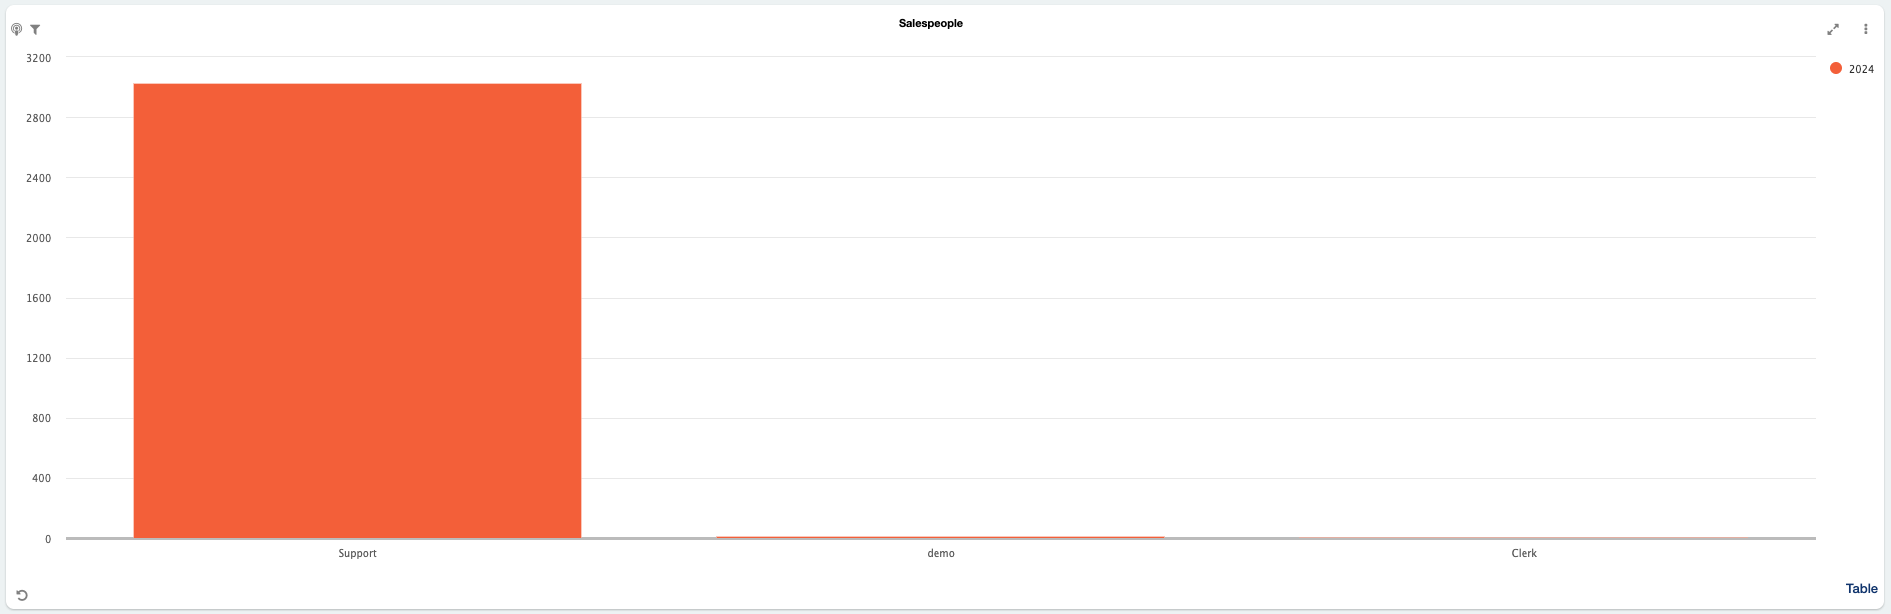
The last tile is about employee performance. This row shows how employees perform in terms of sales. You can see in one overview the amount of sales each person generates.
Tile options
Views
Certain tiles have optional views to select. For example, the tile for the weekly turnover can be displayed for the month or over the year as well. Simply select the option you like to be displayed.
Selective data
By selecting a singular data-bar of a tile, the data of the whole dashboard will adjust the information of each tile in dependence of the selected data-bar. For example, if you want more information about your turnover in April, just click on April.
reset icon
To reset applied views of a tile, use the in the bottom left of the corresponding tile.
Full-screen
In addition, a graph of a tile can always be displayed in full-screen mode. To expand a graph, use the expanding arrow icon.
Further options
- Click the three dots in the top right corner of the corresponding tile
- You now can update the data for the tile manually by clicking the update icon
- Or even export the data as CSV, PDF or Word file, to do so use the corresponding export icons
🎓 Downloadable PDF
We want your feedback
Your opinion is very important to us. Did you like this tutorial? Was it helpful? Rate it using the emojis down below.